Image source commons.wikimedia.org
The Map Project….
Well, we are in an art class, so we ain’t making traditional maps… but I guess you know that by know. We are making art maps. Esoteric maps… [intended for or likely to be understood by only a small number of people with a specialised knowledge or interest : esoteric philosophicaldebates.]
Can you map out everything that lead up to the first time you got grounded? How about a map which showed the first time you remember figuring out you were alone in this big cold world? Can you map out your future? What about mapping where, and how, you go after you die. Could you map your first kiss? Hmmm, sound complex? well, you a simple idea will be just fine for this project. You see I am asking you to do two things here. Develop a concept/idea and make/find a bunch of marks, symbols, or pictures to illustrate you concept
What will a good map contain?
A good map will have a legend or key which will show the user what different symbols mean. For instance, a square with a flag on top usually represents a school and roads are represented by a variety of widths and combinations of lines. Often a dashed line represents a border. Note, however, that map symbols used in the Canada are often used for different things in other countries. The symbol for a secondary highway on a USGS Topographic map is equivalent to a railroad in Switzerland. Make sure to read the legend and you’ll understand the symbols.
Project Criteria:
Graphic components that must be included:
Content/Concept:
- One simple idea that you make visually apparent. Page of writing emailed to me at dkeller@vsb.bc.ca
- A path from one thing to another… is’int that what a map is?
Things you might include:
- Text, poems, writing, letters
- Different languages
- Images
- Photos
- Cut-outs
- Drawings
- Latitudes and longitudes
- Stamps
- Stains
Mediums you could use:
- Paint
- Drawing Inks [Colored]
- Pencils
- Collage
- Lettrocet
Things that you could use as the basis for your map:
- Paper
- Old maps
- Clothing
- Pieces of material
- Shower curtains
Steps: [This part will be updated this weekend]
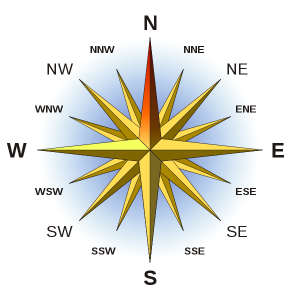
- Start off by making a legend (A Key). Be sure to include things you can notice or identify, such as landmarks. Be sure to add a compass. This will tell people where north and south is.
- Create a suitable scale. This is an indicator of how many units on the map (inches/centimeters) are in a unit in the actual place (miles/kilometers). This allows distances to be determined from the map.
- If you’re making a more complex map, add latitude and longitude lines. They should be evenly spaced. If your map is relatively small, then consider using a ruler to help you draw the latitude and longitude lines.
- Colour in for visual aid. Make sure you color it in according to the elevation, and add the colors into the key. This way, people can easily identify the elevation. Elevation makes a huge impact on the amount of time it will take to drive to a location.
- Draw streets. If you want a better map, try drawing streets to make it more “map-like.” If your map is small, try drawing small buildings to be more comfortable with the town, city, neighborhood, etc.
Introduction to map making:
Map making is an art form dating back into the depths of time. Before there were GPS’ (global positioning satellites) , there were maps. It took a skilled mathematician and artist to create a precise map, and sailors and navigators around the world relied on exact accuracy. Maps can be symbolic, imaginary, or just plain useful. But there are too many types of maps to discuss in one place, so I will concentrate my energies on a single subject: that of fantasy map making.
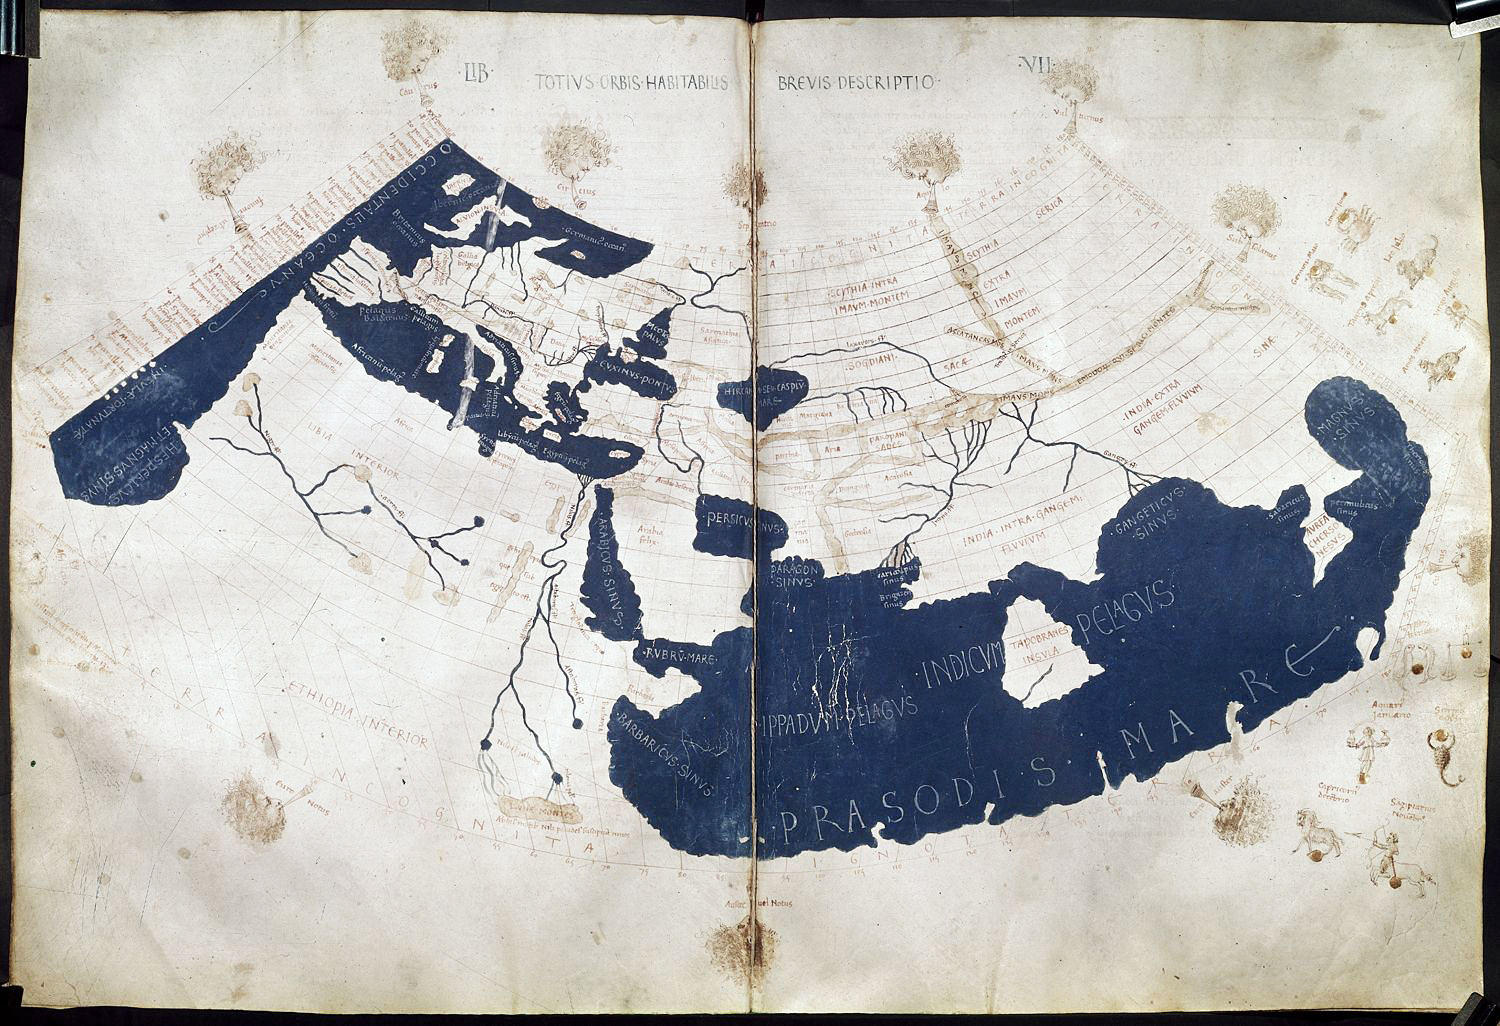
Image source en.wikipedia.org Ptolemy’s world map, reconstituted from Ptolemy’s Geography (circa 150) in the 15th century, indicating “Sinae”
What is a Map?
A map is a graphic representation or scale model of spatial concepts. It is a means for conveying geographic information. Maps are a universal medium for communication, easily understood and appreciated by most people, regardless of language or culture. Incorporated in a map is the understanding that it is a “snapshot” of an idea, a single picture, a selection of concepts from a constantly changing database of geographic information (Merriam 1996).
Old maps provide much information about what was known in times past, as well as the philosophy and cultural basis of the map, which were often much different from modern cartography. Maps are one means by which scientists distribute their ideas and pass them on to future generations (Merriam 1996).
Early Maps
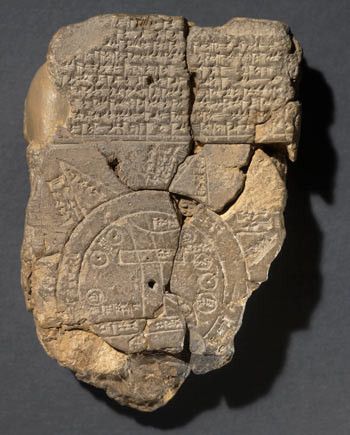
Image source historical-nonfiction.tumblr.com Map of the world – 600 BCE This artefact was discovered in Iraq close to the Euphrates river in the late 1800s and first published (or written about) in 1899. It has been dated to around 600 BCE. This was the oldest known map for several decades until the Nippur map (see above) was finally published. The Babylonian Map is currently in the British Museum.
Cartography is the art and science of making maps. The oldest known maps are preserved on Babylonian clay tablets from about 2300 B.C. Cartography was considerably advanced in ancient Greece. The concept of a spherical Earth was well known among Greek philosophers by the time of Aristotle (ca. 350 B.C.) and has been accepted by all geographers since.
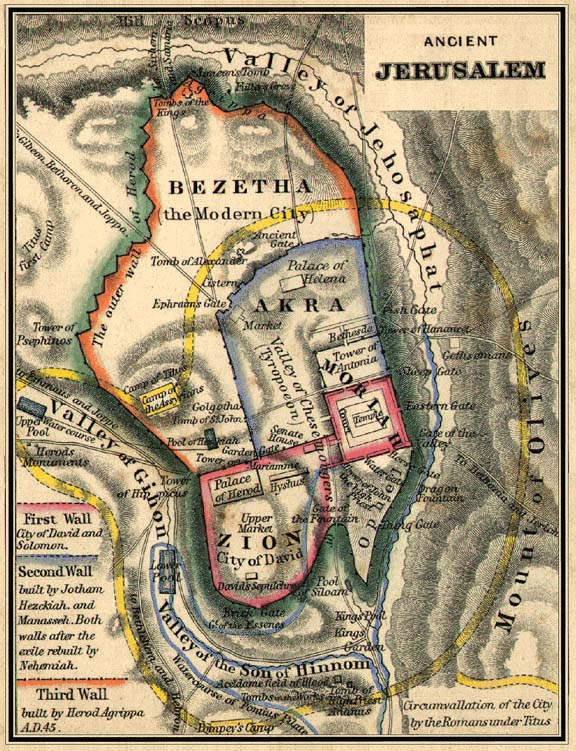
Image source www.menorahcoinproject.org
Map of Ancient Jerusalem
Greek and Roman cartography reached a culmination with Claudius Ptolemaeus (Ptolemy, about A.D. 85-165). His “world map” depicted the Old World from about 60°N to 30°S latitudes. He wrote a monumental work, Guide to Geography (Geographike hyphygesis), which remained an authoritative reference on world geography until the Renaissance.
Ptolemy’s map of the world.
(ca. 150, republished 1482)
Medieval Maps
During the Medieval period, European maps were dominated by religious views. The T-O map was common. In this map format, Jerusalem was depicted at the center and east was oriented toward the map top. Viking explorations in the North Atlantic gradually were incorporated into the world view beginning in the 12th century. Meanwhile, cartography developed along more practical and realistic lines in Arabic lands, including the Mediterranean region. All maps were, of course, drawn and illuminated by hand, which made the distribution of maps extremely limited.
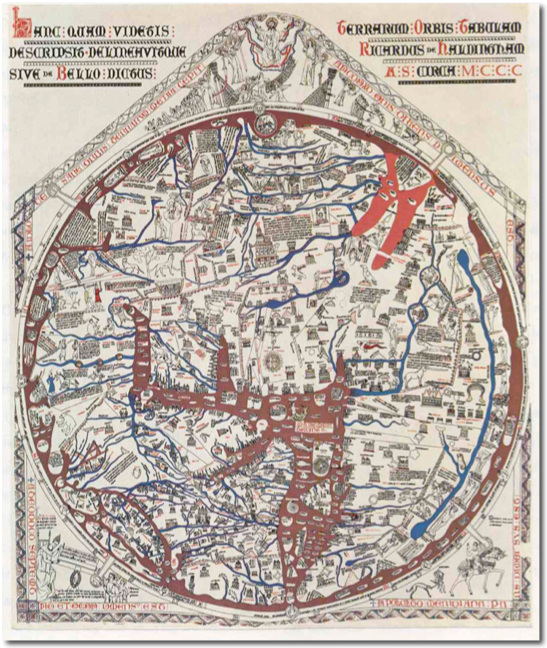
Image source cartographic-images-net
Hereford mappa mundi 1300 ACE
Vesconte’s world map (1321).
Hereford Mapa Mundi (1290).
al-Idrisi’s world map (12th century).
Renaissance Maps
The invention of printing made maps much more widely available beginning in the 15th century. Maps were at first printed using carved wooden blocks (see above). Among the most important map makers of this period was Sebastian Münster in Basel (now Switzerland). His Geographia, published in 1540, became the new global standard for maps of the world.
Printing with engraved copper plates appeared in the 16th century and continued to be the standard until photographic techniques were developed. Major advances in cartography took place during the Age of Exploration in the 15th and 16th centuries. Map makers responded with navigation charts, which depicted coast lines, islands, rivers, harbors, and features of sailing interest. Compass lines and other navigation aids were included, new map projections were devised, and globes were constructed. Such maps and globes were held in great value for economic, military, and diplomatic purposes, and so were often treated as national or commercial secrets–classified or proprietary maps.
The first whole-world maps began to appear in the early 16th century, following voyages by Columbus and others to the New World. The first true world map is generally credited to Martin Waldseemüller in 1507. This map utilized an expanded Ptolemaic projection and was the first map to use the name America for the New World–see Waldseemüller’s world map.
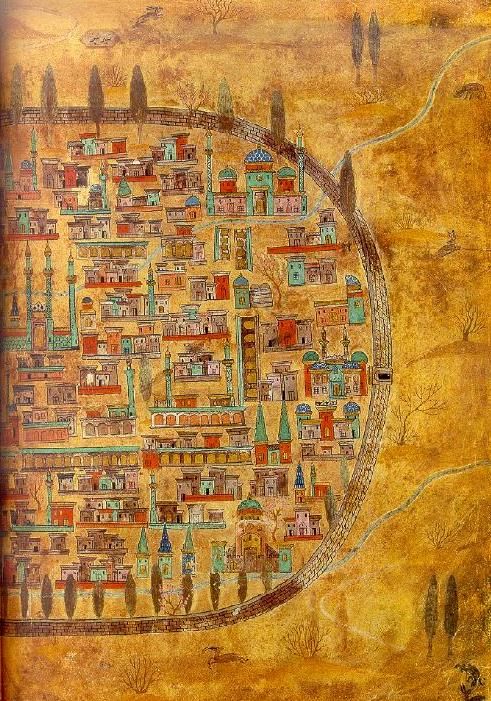
Image source muslimheritage-com
Plan of Tabriz, Iran by the 16th Century Ottoman polymath Nasuh Al-Matrakî. From Al-Matrakî’s Beyân-i Menâzil-i Sefer-i ‘Irakeyn.
Heart-shaped projection by Sylvanus (1511).
Fully expanded Ptolemaic projection.
Gerardus Mercator of Flanders (Belgium) was the leading cartographer of the mid-16th century. He developed a cylindrical projection that is still widely used for navigation charts and global maps. He published a map of the world in 1569 based on this projection. Many other map projections were soon developed.
Mercator’s world map (1569).
Mercator’s polar projection (1595).
Modern Maps
Maps became increasingly accurate and factual during the 17th, 18th and 19th centuries with the application of scientific methods. Many countries undertook national mapping programs. Nonetheless, much of the world was poorly known until the widespread use of aerial photography following World War I. Modern cartography is based on a combination of ground observations and remote sensing.
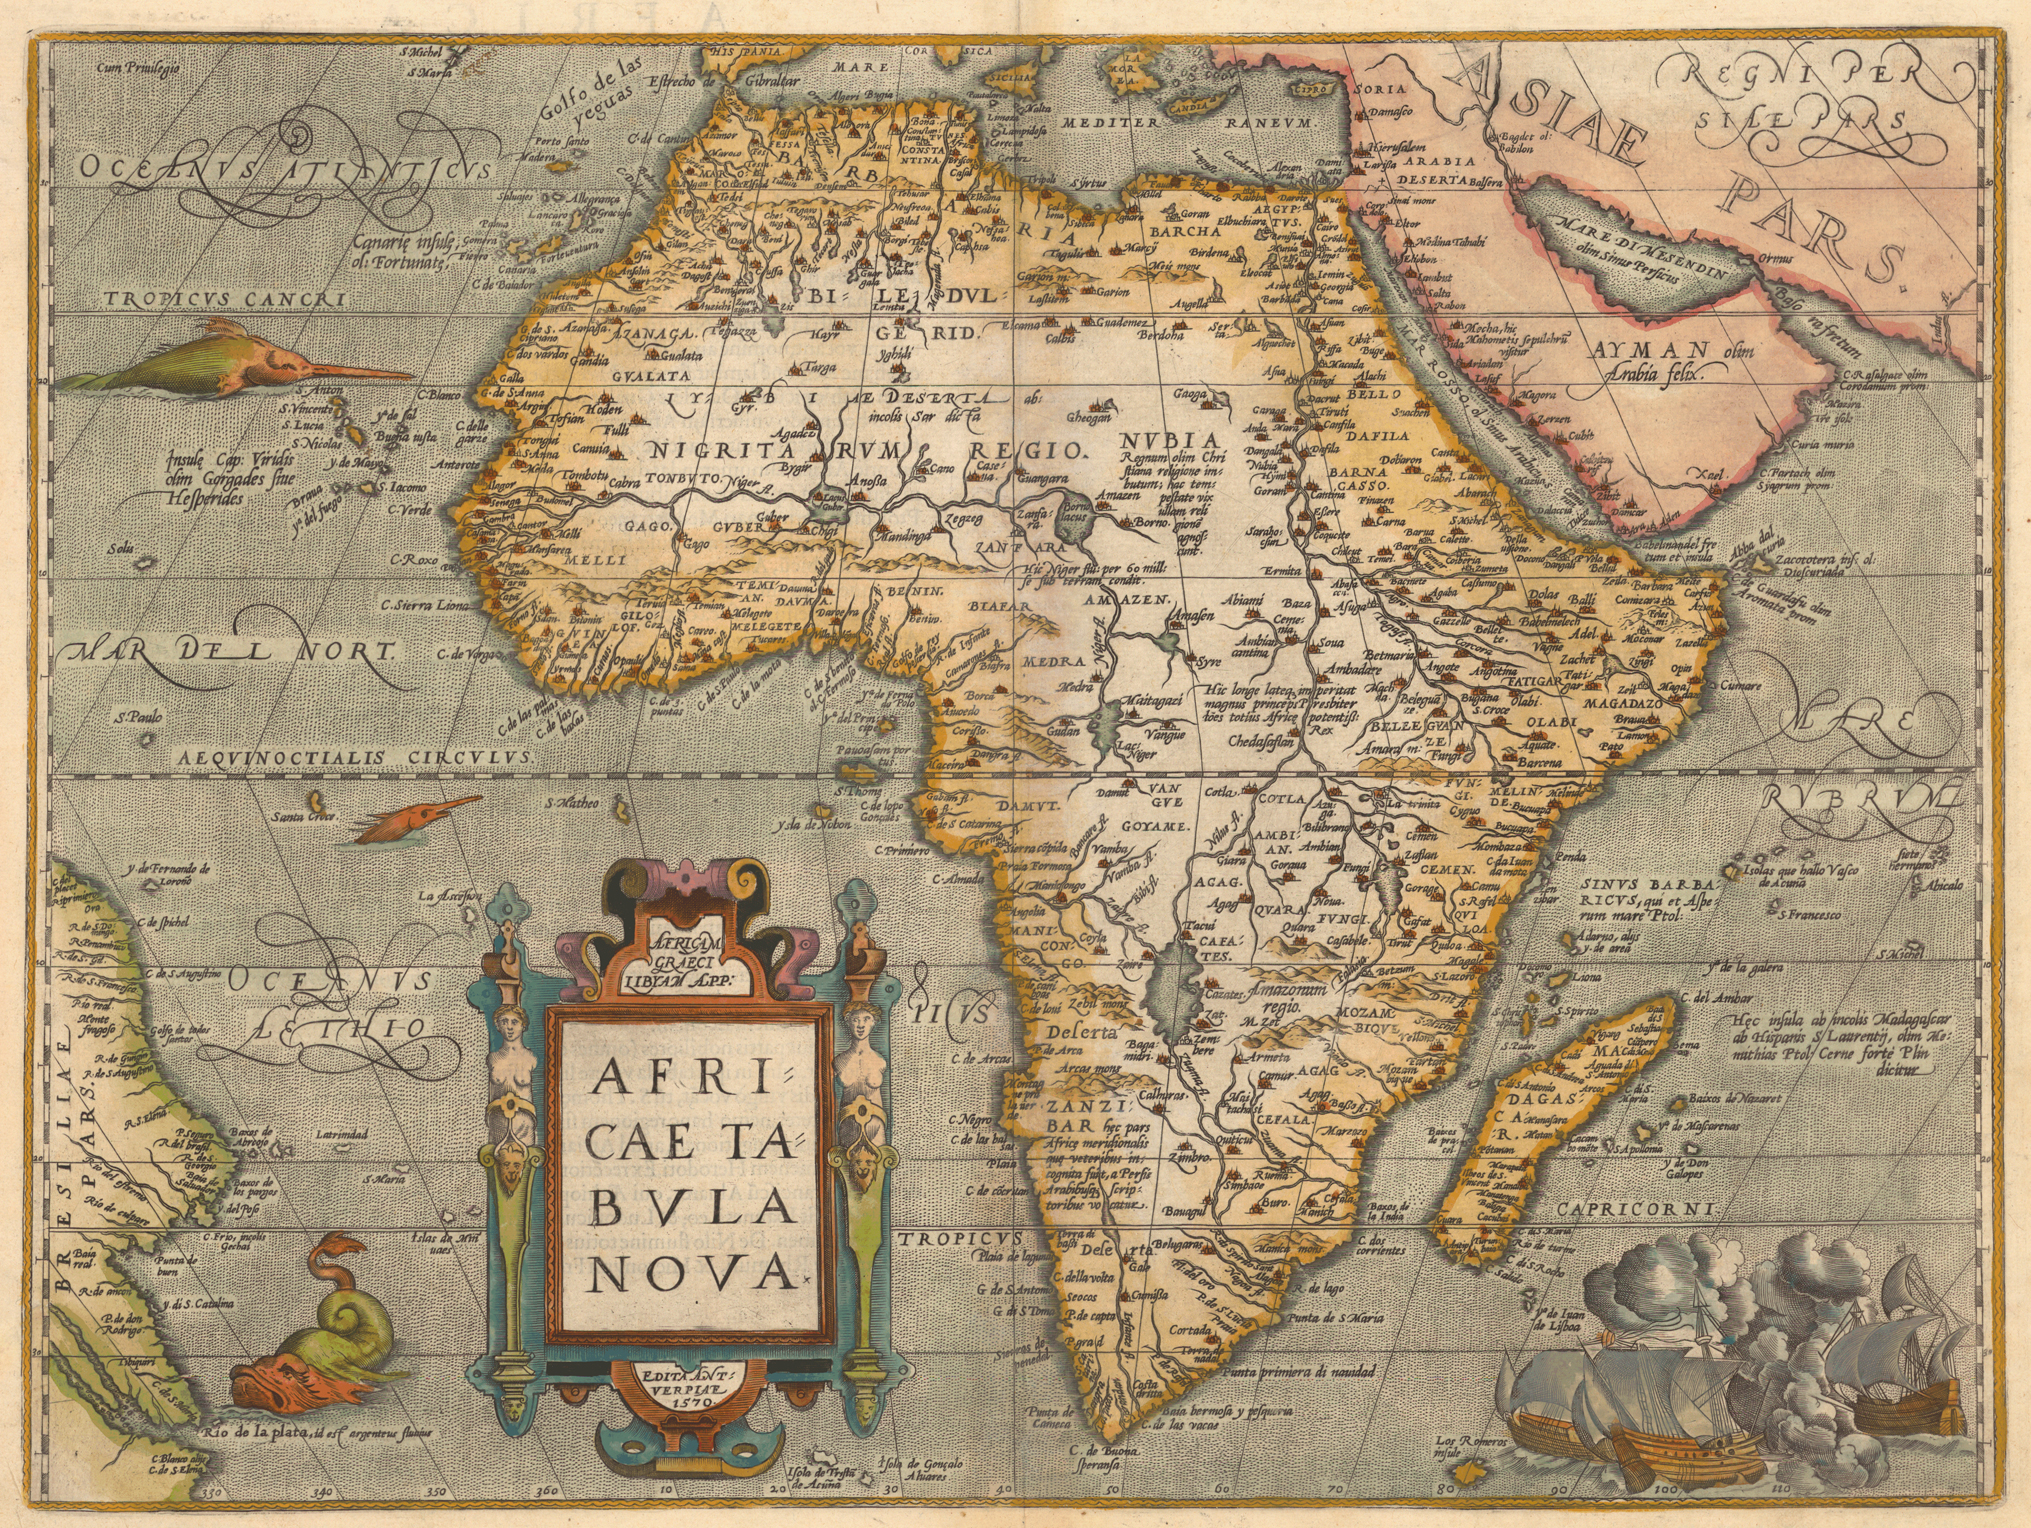
Image source live.dbpedia.org
What is a Map?
Are maps realistic representations of the actual world? No–never! Field measurements are subject to errors of accuracy and precision. Aerial photographs and satellite images portray only certain portions of the light spectrum, as filtered through the atmosphere and detection instruments. No map can depict all physical, biological, and cultural features for even the smallest area. A map can display only a few selected features, which are portrayed usually in highly symbolic styles according to some kind of classification scheme. In these ways, all maps are estimations, generalisations, and interpretations of true geographic conditions
All maps are made according to certain basic assumptions for example sea-level datum, which is not always true or verifiable. Finally, any map is the product of human endeavours and as such may be subject to unwitting errors, misrepresentation, bias, or outright fraud. In spite of these limitations, maps have proven to be remarkably adaptable and useful through several millennia of human civilisation. Maps of all kinds are fundamentally important for modern society.
The fool’s cap world map, about 1590. Ptolemaic projection on the face of a jester. Maker, date, and place of publication are unknown. Maps are human representations of the world, as seen through the eyes of a clown in this example. Widely reproduced to depict the human element of cartography. Image adapted from Dalhousie University, Canada.

Image source drakeequation.wordpress.com Fools cap map
Because maps are one of the most entrancing things within the covers of a good book. Role players, authors, and world builders all use maps in their work, and I am here to make sure that they are given the chance to produce quality maps for any of their needs. Anyone and everyone can draw a very respectable map given the time and implementations necessary for their undertaking.
The Project….
Well, we are in an art class, so we ain’t making traditional maps… but I guess you know that by know. We are making art maps. Esoteric maps… [intended for or likely to be understood by only a small number of people with a specialised knowledge or interest : esoteric philosophical debates.]
Could you map your first kiss? How about the first time you got grounded? The first time you really remember figuring out you were alone in this big cold world?
Can you map out your future? What about mapping where, and how, you go after you die.
What will a good map contain?
A good map will have a legend or key which will show the user what different symbols mean. For instance, a square with a flag on top usually represents a school and roads are represented by a variety of widths and combinations of lines. Often a dashed line represents a border. Note, however, that map symbols used in the United States are often used for different things in other countries. The symbol for a secondary highway on a USGS Topographic map is equivalent to a railroad in Switzerland. Make sure to read the legend and you’ll understand the symbols.
Project Criteria:
Graphic components that must be included:
- Compos Rose
- Legend
- Scale
- Images that represent things…
- A border
Content/Concept:
- One simple idea that you make visually apparent. Page of writing emailed to me at dkeller@vsb.bc.ca
- A path from one thing to another… is’int that what a map is?
Things you might include:
- Text, poems, writing, letters
- Different languages
- Images
- Photos
- Cut-outs
- Drawings
- Latitudes and longitudes
- Stamps
- Stains
Mediums you could use:
- Paint
- Drawing Inks [Colored]
- Pencils
- Collage
- Lettrocet
Things that you could use as the basis for your map:
- Paper
- Old maps
- Clothing
- Pieces of material
- Shower curtains
Steps: [This part will be updated this weekend]
- Start off by making a legend (A Key). Be sure to include things you can notice or identify, such as landmarks. Be sure to add a compass. This will tell people where north and south is.
- Create a suitable scale. This is an indicator of how many units on the map (inches/centimeters) are in a unit in the actual place (miles/kilometers). This allows distances to be determined from the map.
- If you’re making a more complex map, add latitude and longitude lines. They should be evenly spaced. If your map is relatively small, then consider using a ruler to help you draw the latitude and longitude lines.
- Colour in for visual aid. Make sure you colour it in according to the elevation and add the colours into the key. This way, people can easily identify the elevation. Elevation makes a huge impact on the amount of time it will take to drive to a location.
- Draw streets. If you want a better map, try drawing streets to make it more “map-like.” If your map is small, try drawing small buildings to be more comfortable with the town, city, neighborhood, etc.